Our software is written and tested in-house to ensure it is rugged and reliable. It has been independently verified by experts in the field to ensure compliance with national, EU and international standards. We use the best hardware we can source in our systems to ensure that they are problem free.
| Program | CEMSuite | CEMSuite + | CEMSuite Power |
|---|---|---|---|
| CEMForm | ⬤ | ⬤ | ⬤ |
| CEMPort | ⬤ | ⬤ | ⬤ |
| CEMQual | ⬤ | ⬤ | |
| WID | ⬤ | ⬤ | |
| LCPD | ⬤ |
Live and Historical Data Display & Processing:
QAL3 Analysis:
Reporting Packages:
Additional Software:
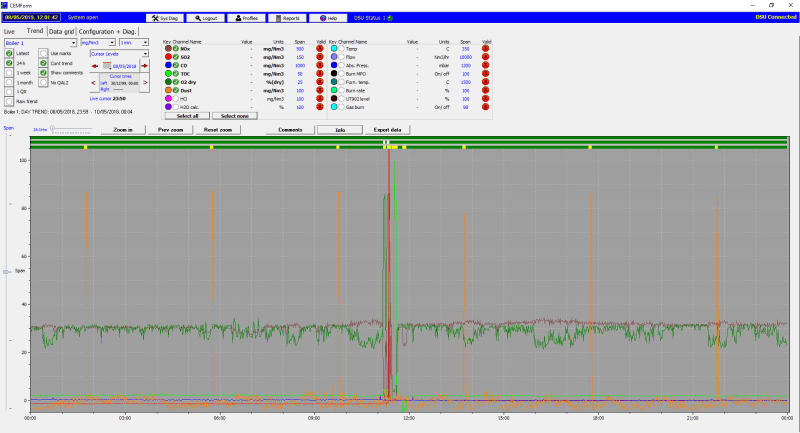
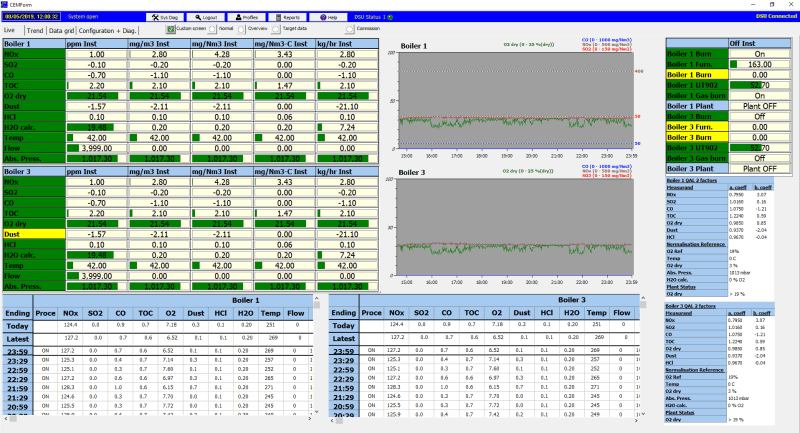
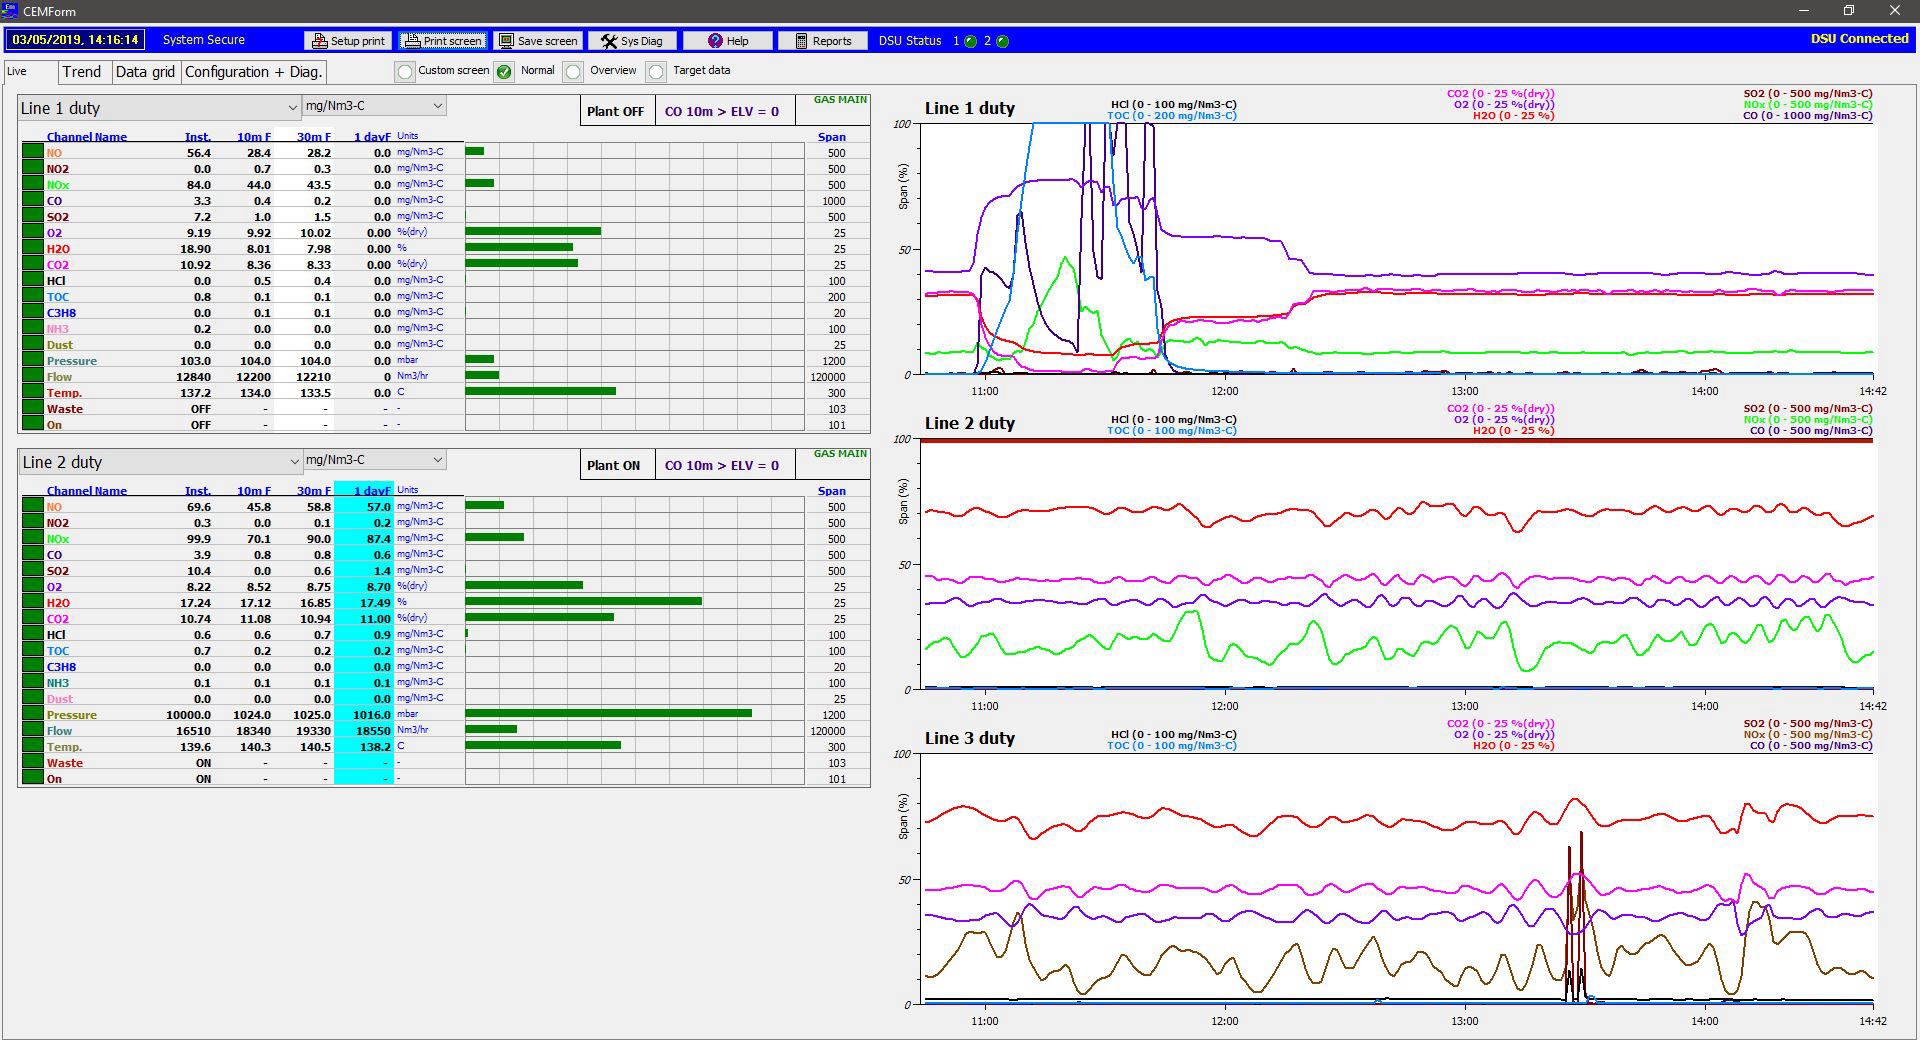
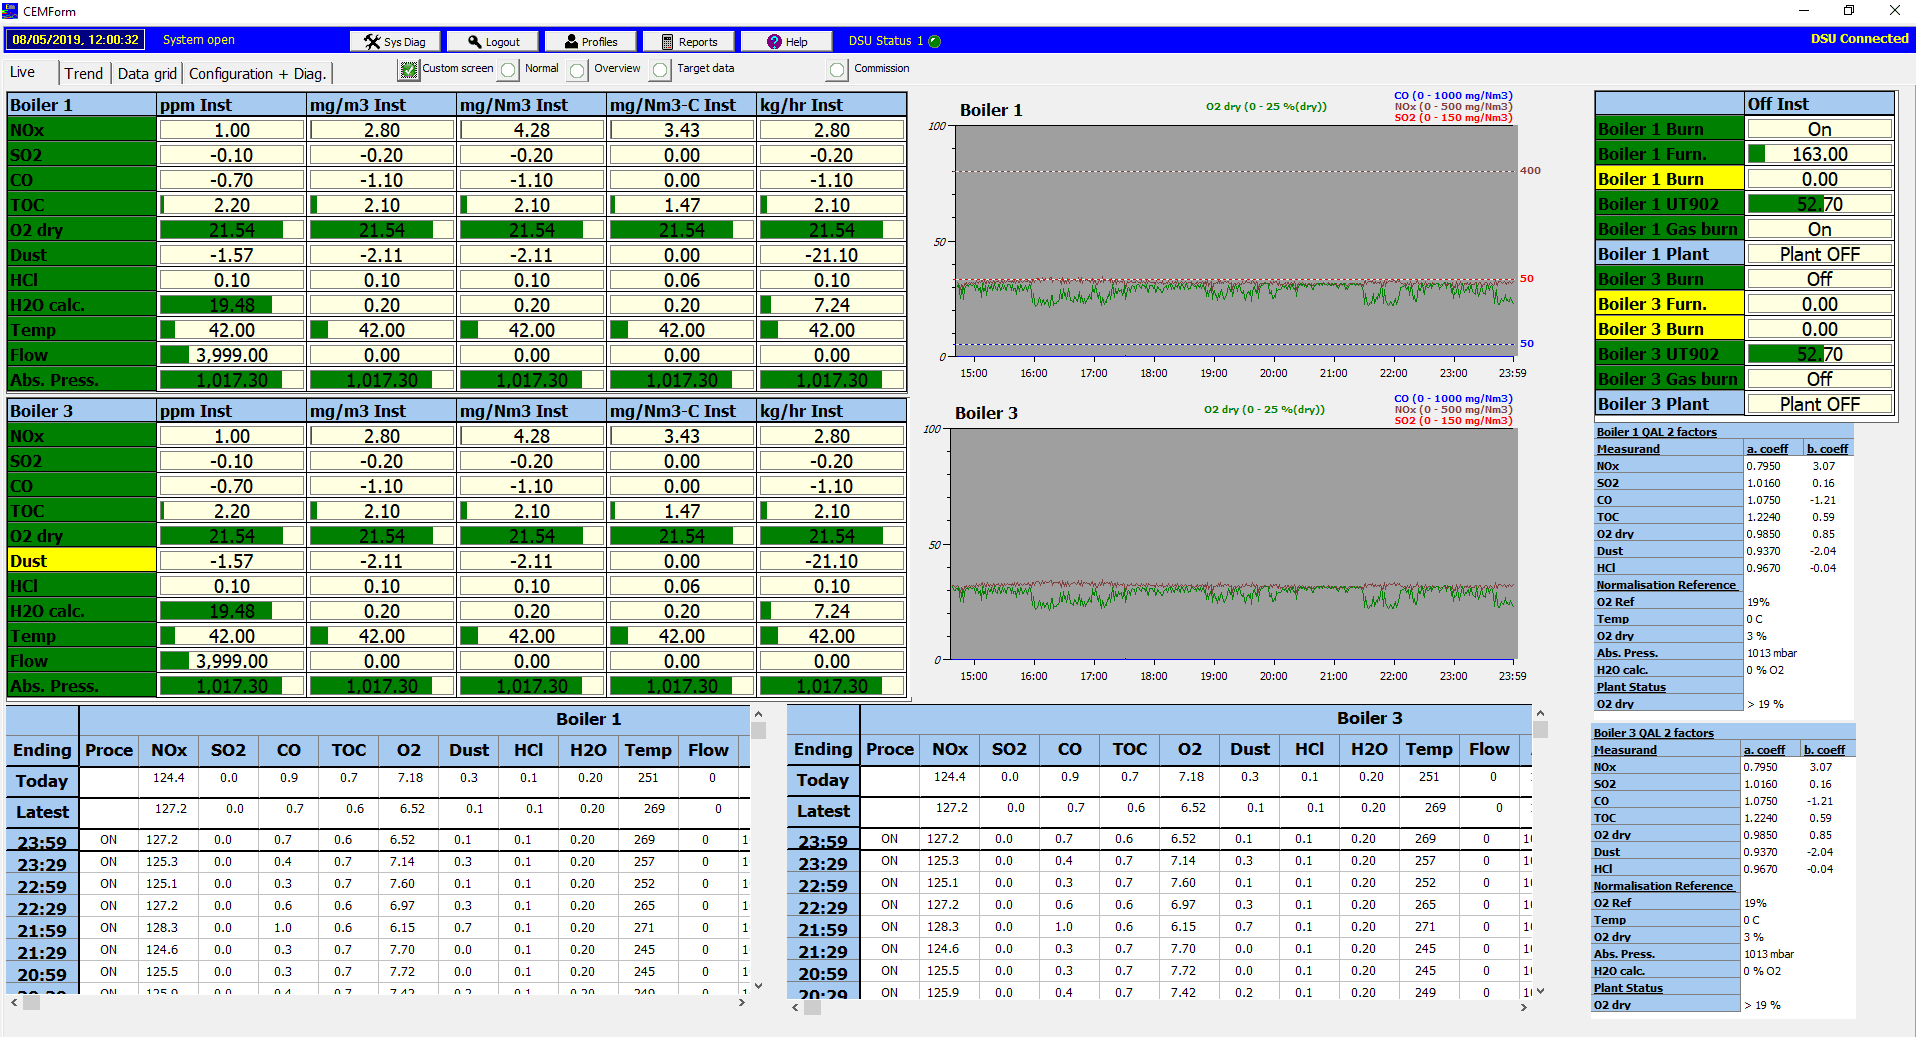
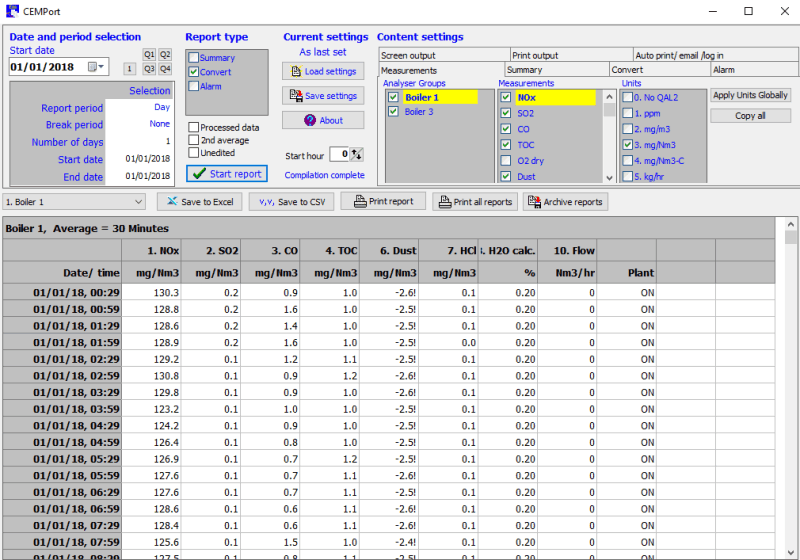
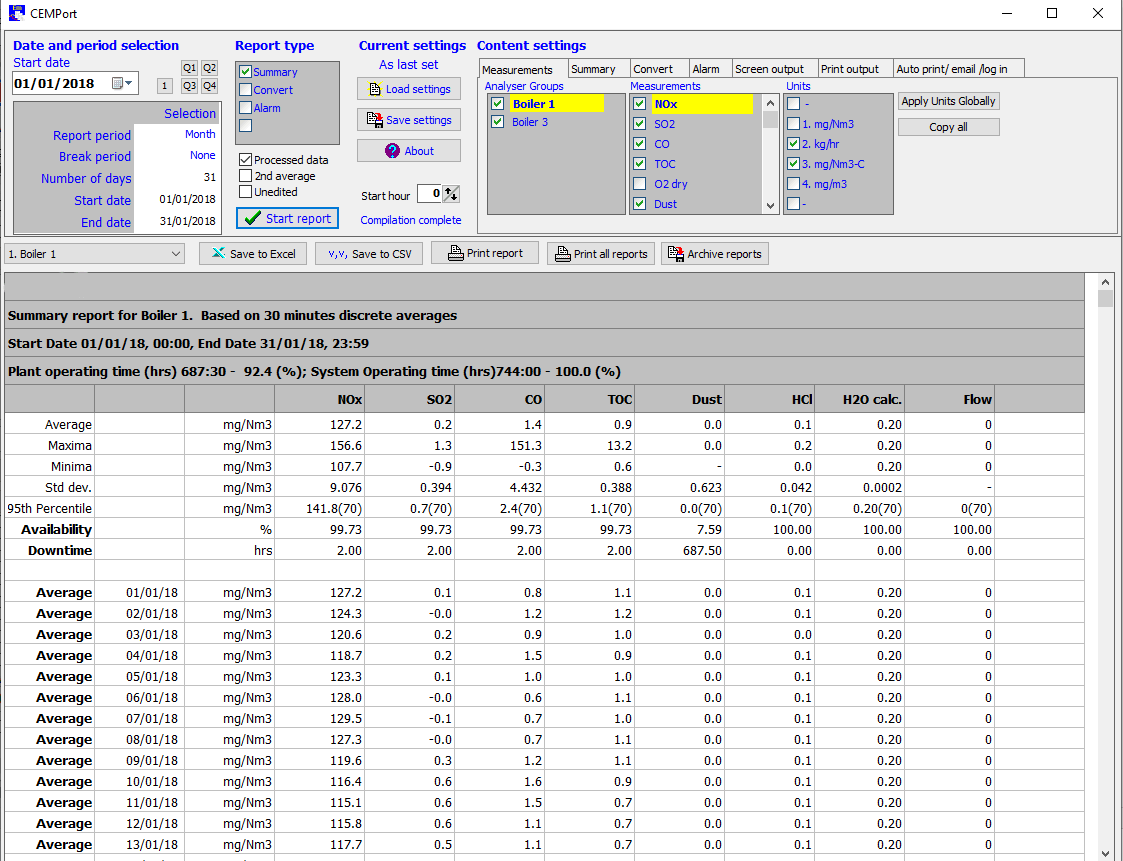
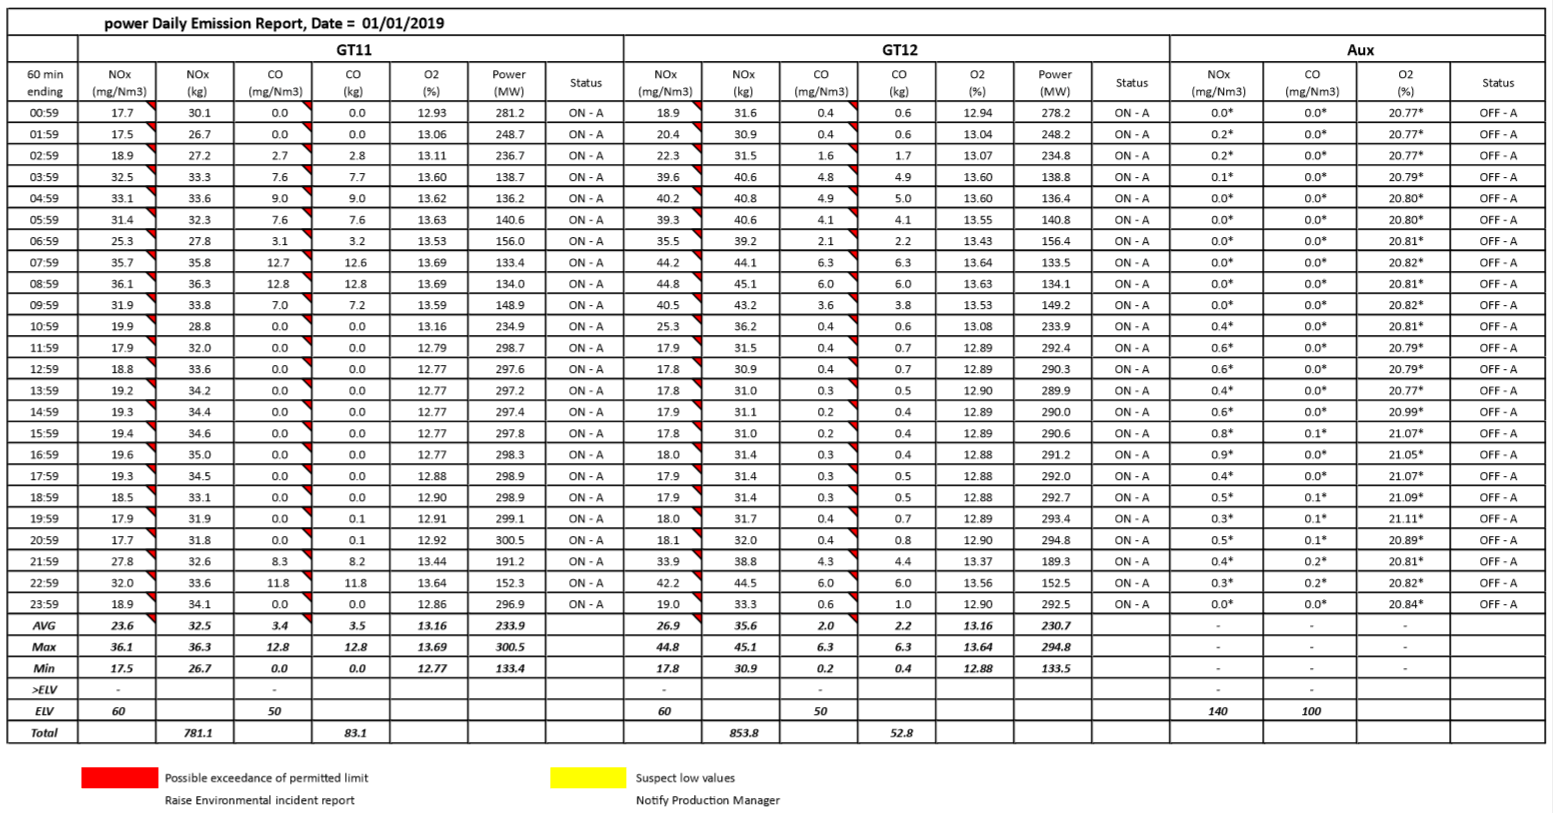
CEMForm is the primary application for viewing instantaneous data and historical trends, consisiting of the primary overview page, trend page and the data grid. The application also handles most of the data processing, such as normalisation and QAL2 factors.
Key Features:
● Update time of <10 seconds
● Fully selectable averages from instantaneous to ½ hourly/hourly, daily & monthly, up to a year
● Alarms & warnings of proximity and exceedance of ELVs
● Simple graphical displays: data for all pertinent averages at the reportable measurement units always available
● Real-time trends plotted with alarm levels for an instant assessment of emission levels in relation to ELVs
● Instantly accessible grid of data for the last 24 hours worth of emissions
● Trends selectable for all measurements for time spans of between 10 minutes up to 1 month
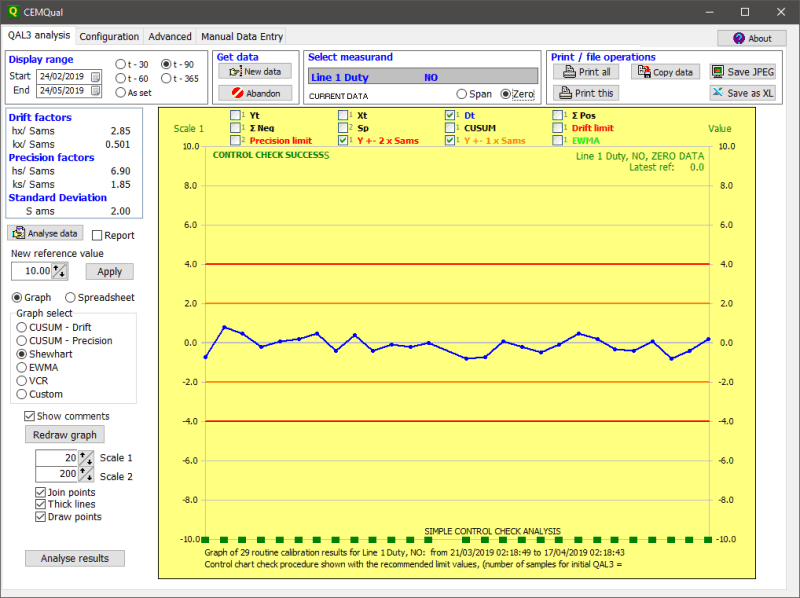
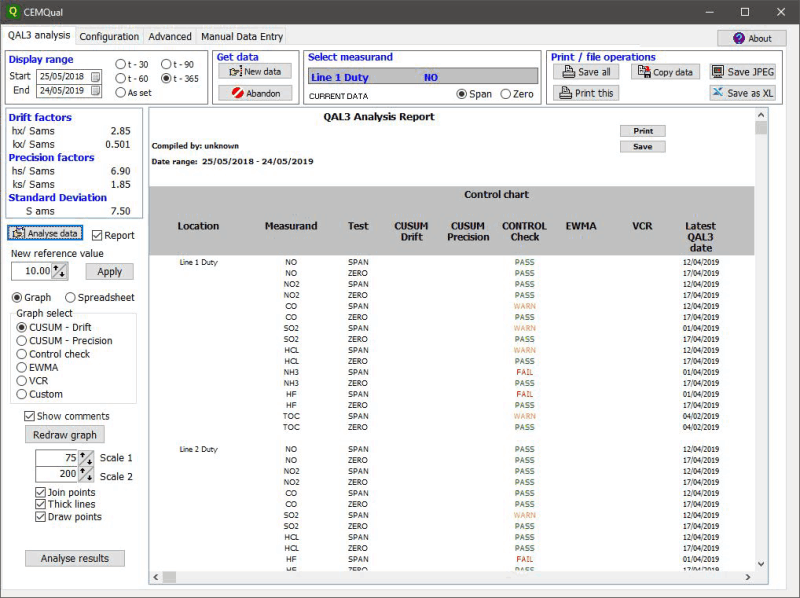
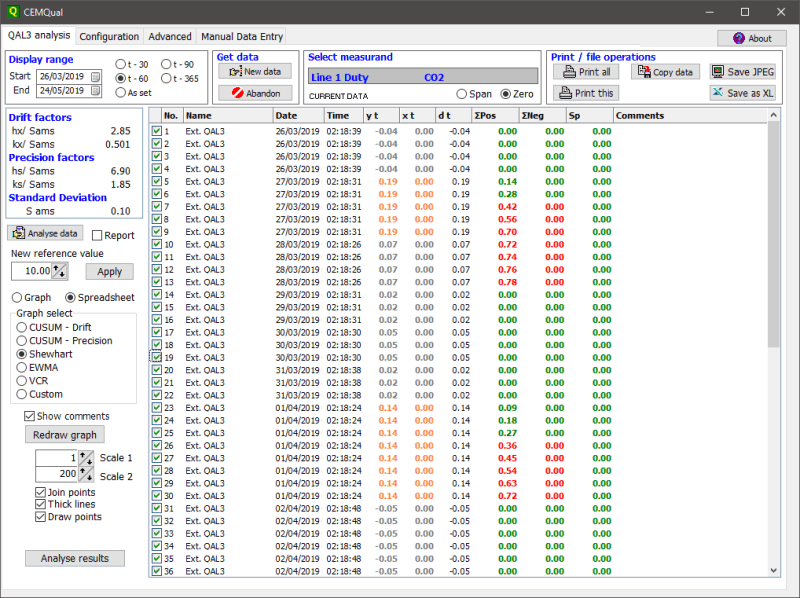
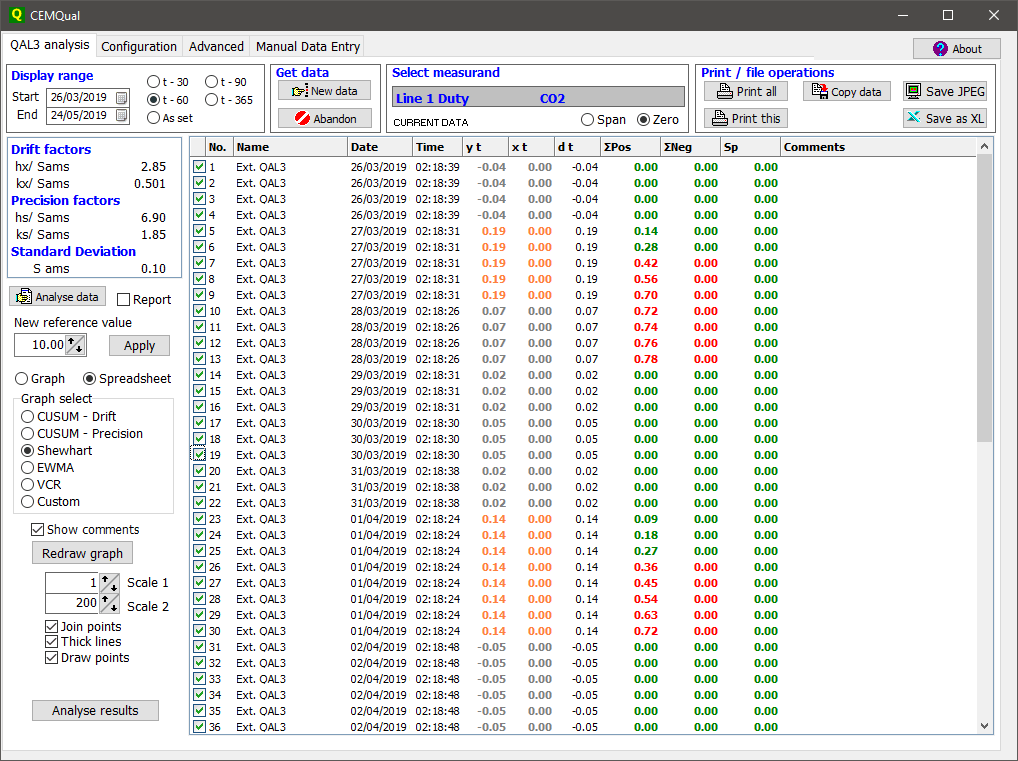
CEMQual allows the user to collect and review their QAL3 results in various different formats, such as an array of charts (SHEWART, CUSUM, EWMA or VCR) or as a data grid.
QAL3 is a procedure for maintaining and demonstrating the quality of the Automated Measuring System (AMS) results during ongoing operation.
Key Features:
● CUSUM drift, CUSUM precision, Shewhart and Exponentially Weighted Moving Average (EWMA) control charts always available
● Data available in spreadsheet style grid and graphical formats
● Operates in parallel with the CEMS
● QAL3 report provides a single page assessment, invaluable for large sites with multiple measurement points and analysers
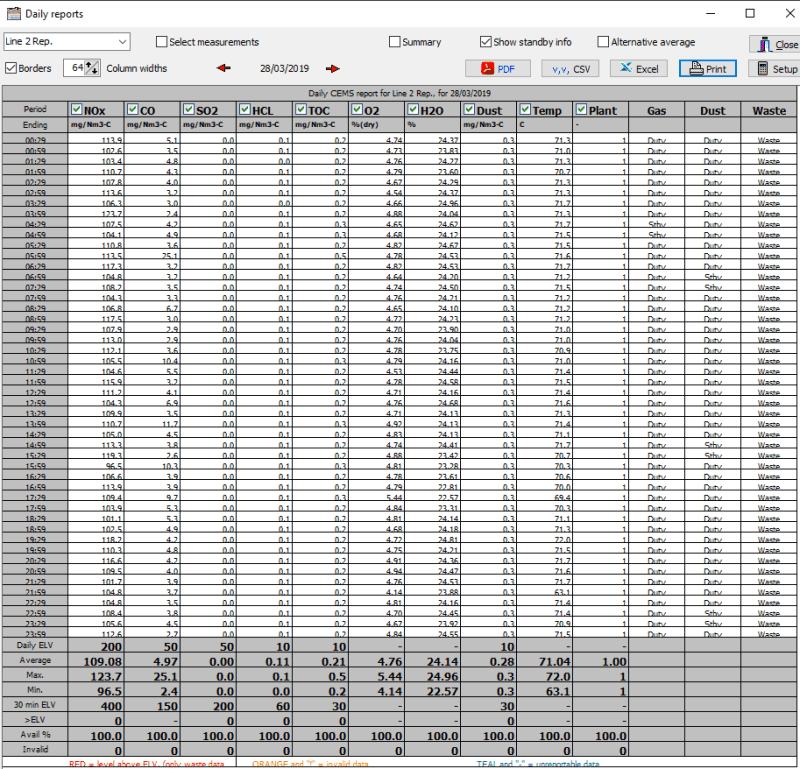
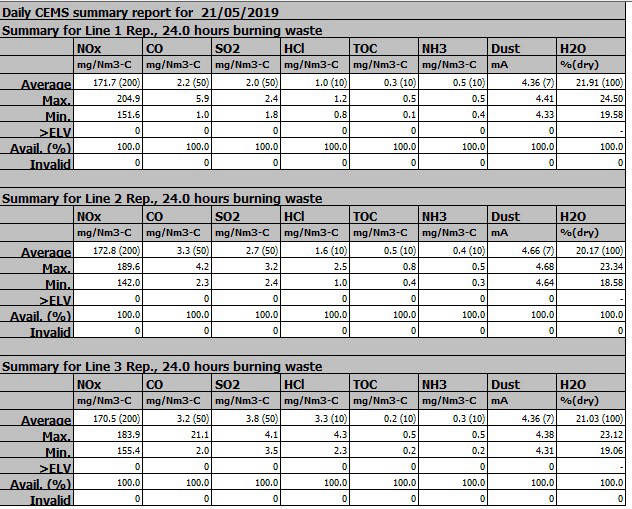
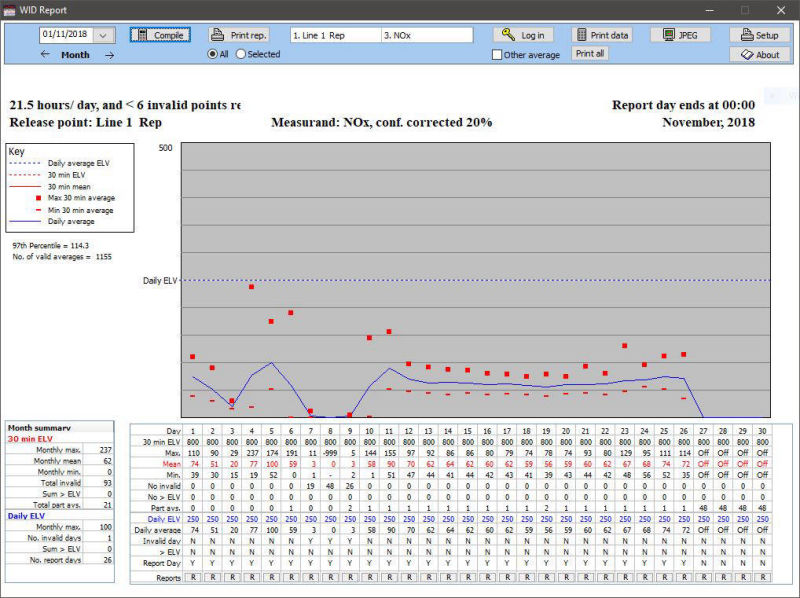
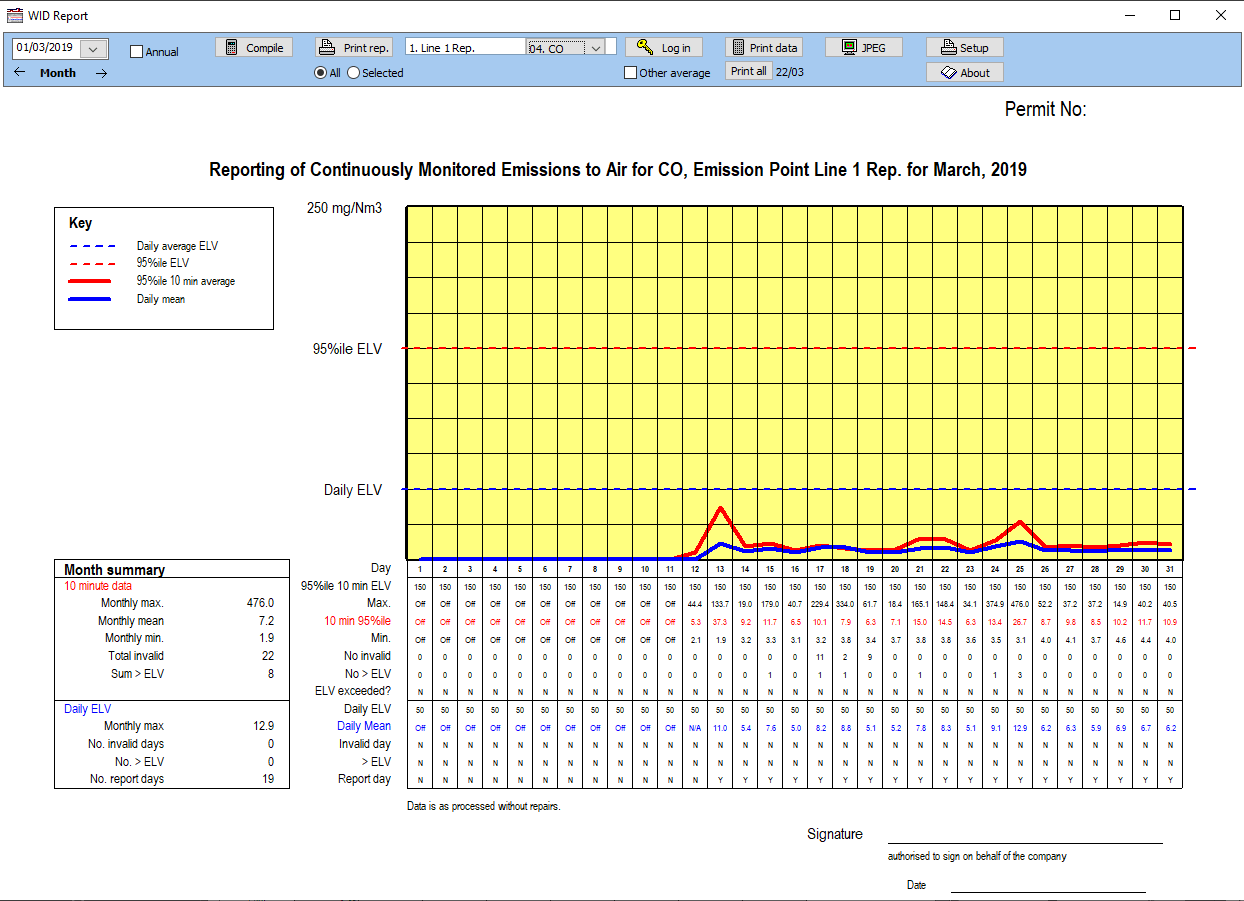
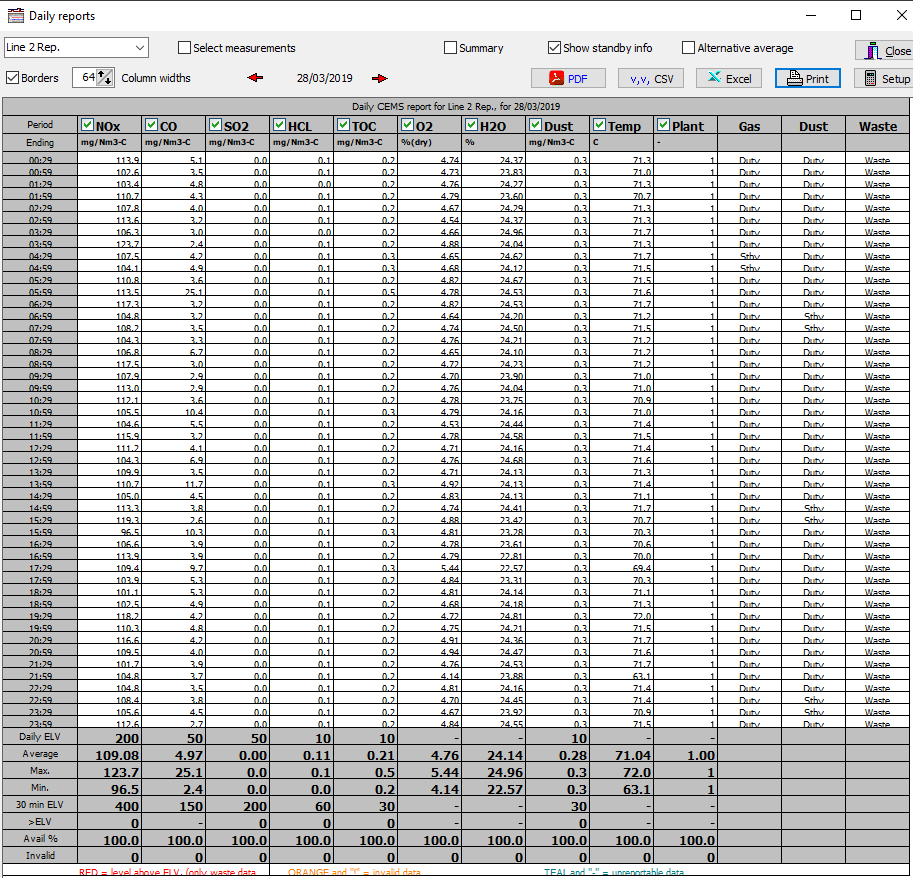
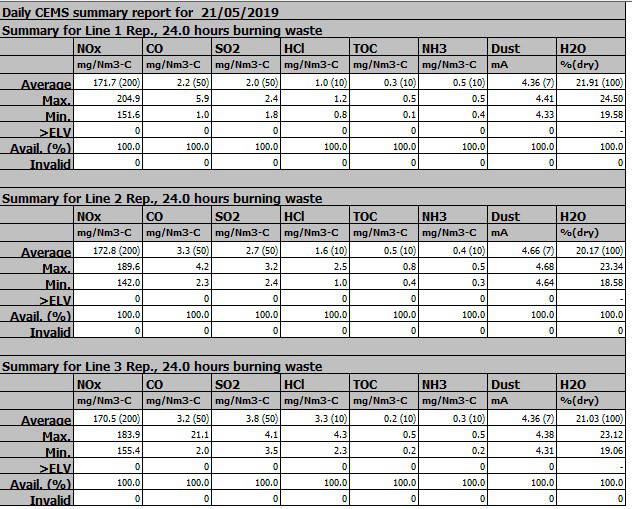
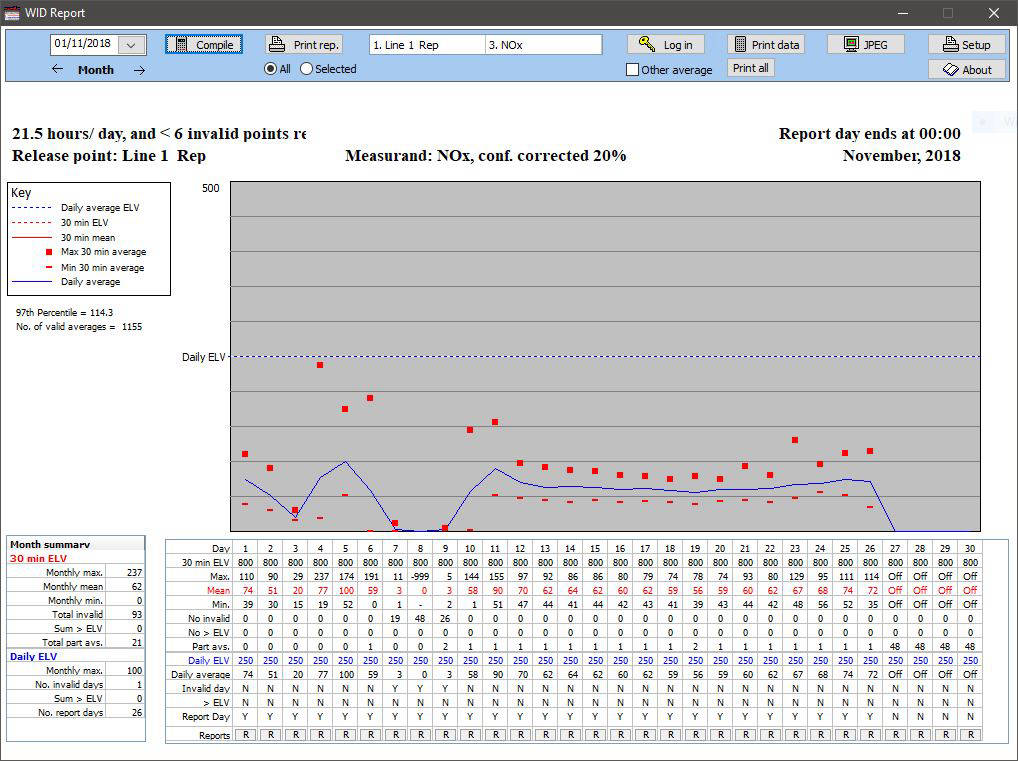
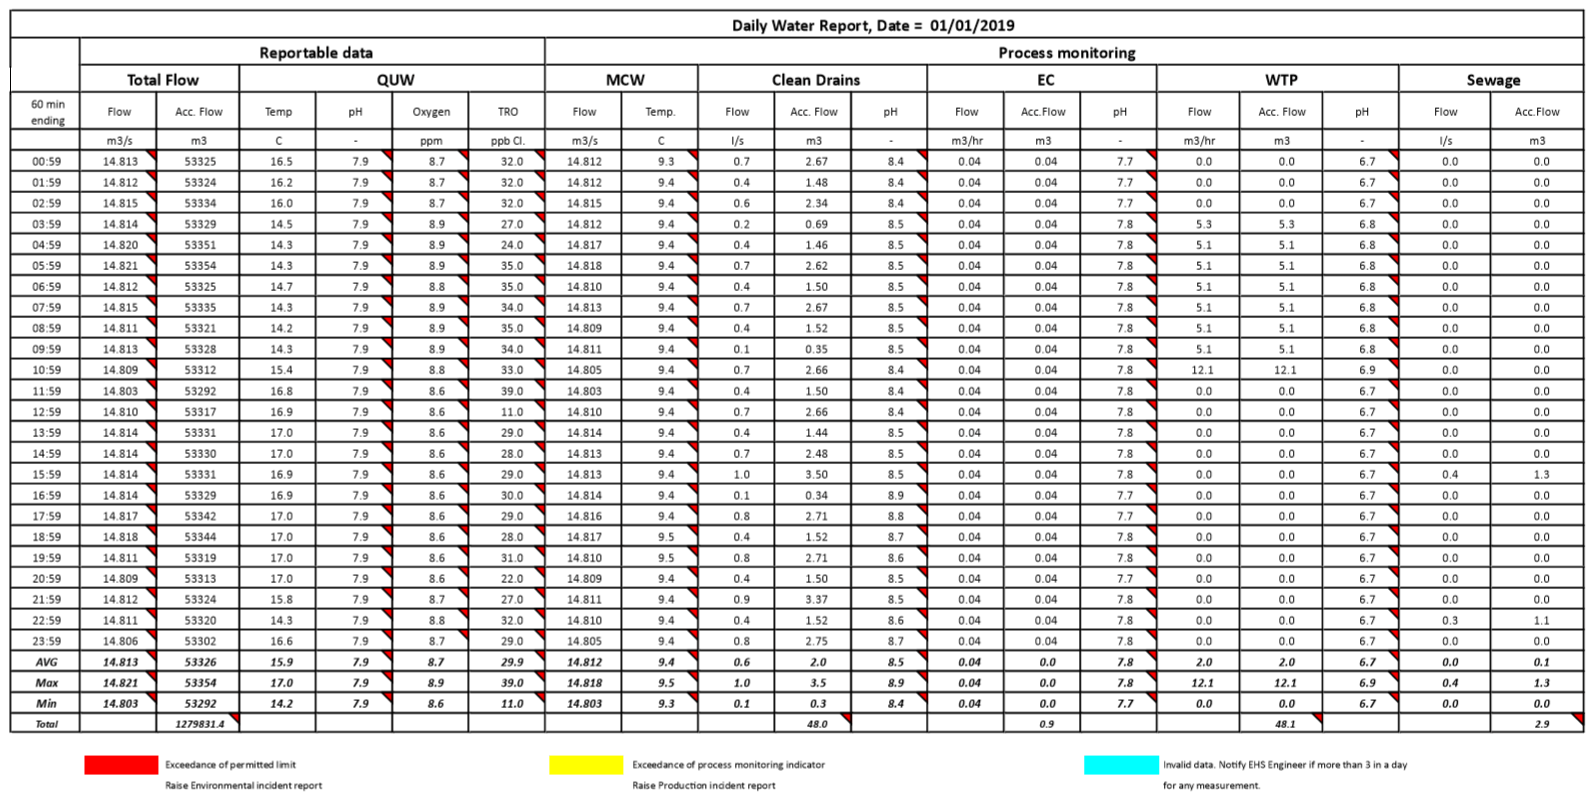
The WID report is a specialised report required for applications covered by the Waste Incineration Directive. It is formulated in calendar month periods and presents core data for easy inspection by the regulatory authorities.
Key Features:
● Simple one-click generation of reports, ready for submission
● Maximum, minimum, average and availability data in tabulated and graphical formats
● Percentile analysis if required
● Daily report generation for internal housekeeping
● Instant access to >10 years of CEMs data
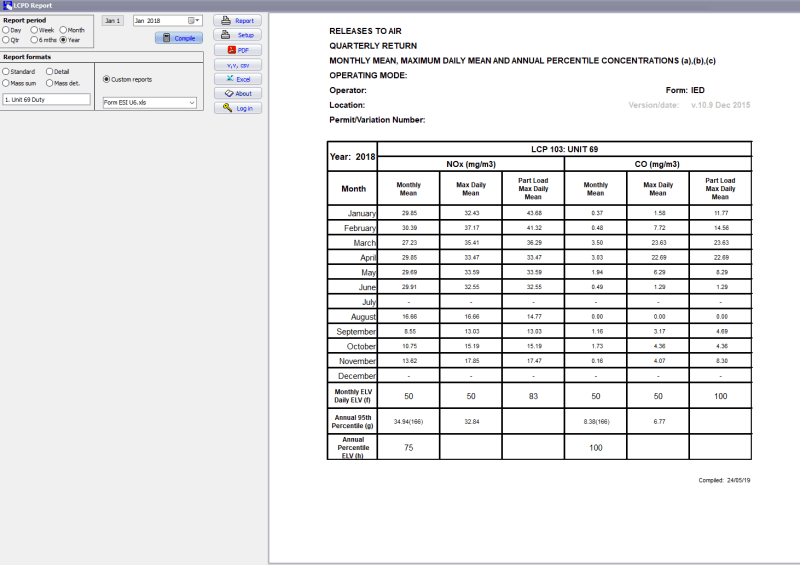
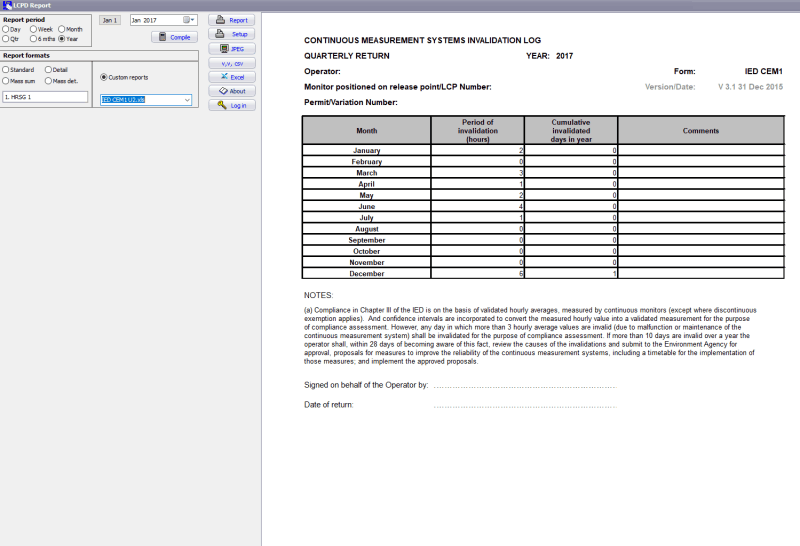
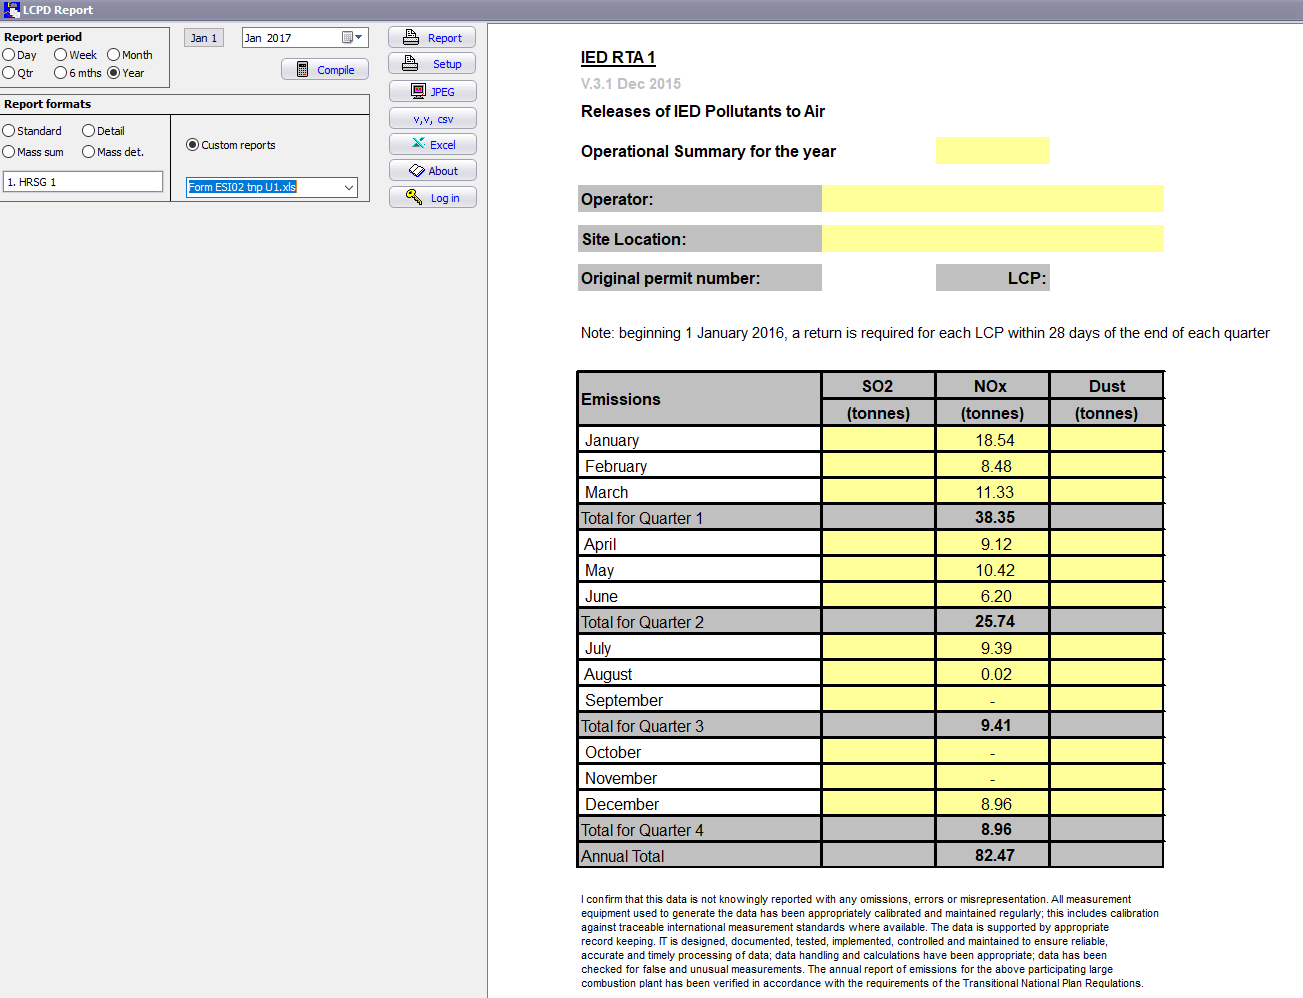
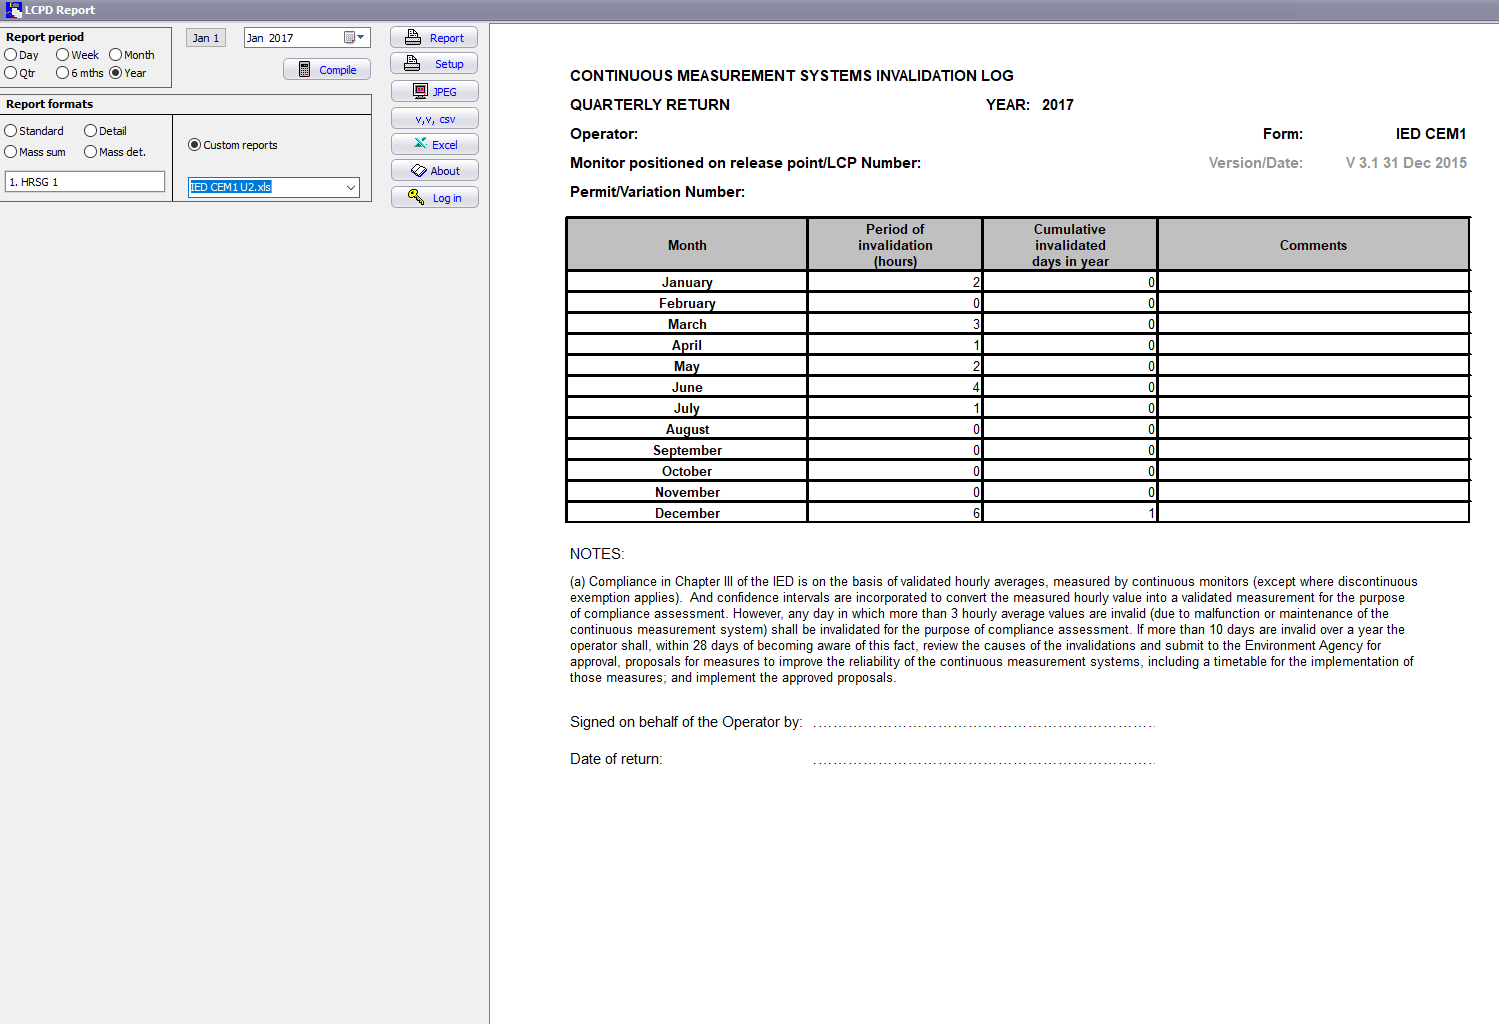
LCPD complies with the reporting requirements of the Large Combustion Plant Directive (Directive 2001/80/EC) and the IED (Directive 2010/75/EU). It takes into account a variety of reporting criteria with respect to Start-up and Shut-down periods, as well as non-reportable periods. With its inherent reporting flexibility, it can produce ready-made, custom reports suitable for practically all requirements.
Key Features:
● Analysis periods from 1 day to 1 year available
● All required statistical analysis, including: percentiles, max and min and standard deviations
● Mass release summaries
● Invalidity reports
● Ready to submit reports, either to print or store for future use
Envirosoft Ltd.
Markham Vale Env. Centre
Markham Vale
Derbyshire UK S44 5HY
✆ +44 (0) 1246 240 043
✉ Sales@Envirosoft.co
✉ Info@Envirosoft.co
Registered Company No. 5100183

AI Website Builder